This tool makes available up-to-date information on all home visiting programs operating in New Mexico, including those funded by the state, federal government, tribal entities, and private organizations. The visualization shows service capacity by program and county, and estimates current need by county. Data is provided by the New Mexico Home Visiting Collaborative, funded by the Los Alamos National Laboratory (LANL) Foundation. Queries may be directed to Rebecca Riley (rebeccariley01@gmail.com).
Data Visualizations
Statewide Home Visiting Capacity 2023
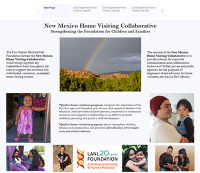
This tool makes available up-to-date information on all home visiting programs operating in New Mexico, including those funded by the state, federal government, tribal entities, and private organizations. The visualization shows service capacity by program and county, and estimates current need by county. Data is provided by the New Mexico Home Visiting Collaborative, funded by the Los Alamos National Laboratory (LANL) Foundation. Queries may be directed to Rebecca Riley (rebeccariley01@gmail.com).
Statewide Home Visiting Capacity 2022

This tool makes available up-to-date information on all home visiting programs operating in New Mexico, including those funded by the state, federal government, tribal entities, and private organizations. The visualization shows service capacity by program and county, and estimates current need by county. Data is provided by the New Mexico Home Visiting Collaborative, funded by the Los Alamos National Laboratory (LANL) Foundation, and will be updated at six-month intervals. Queries may be directed to belld@unm.edu.
Statewide Home Visiting Capacity 2018-2020

This tool makes available up-to-date information on all home visiting programs operating in New Mexico, including those funded by the state, federal government, tribal entities, and private organizations. The visualization shows service capacity by program and county, and estimates current need by county. Data is provided by the New Mexico Home Visiting Collaborative, funded by the Los Alamos National Laboratory (LANL) Foundation, and will be updated at six-month intervals. Queries may be directed to belld@unm.edu.
Statewide Home Visiting Capacity 2016-2018

This tool makes available up-to-date information on all home visiting programs operating in New Mexico, including those funded by the state, federal government, tribal entities, and private organizations. The visualization shows service capacity by program and county, and estimates current need by county. Data is provided by the New Mexico Home Visiting Collaborative, funded by the Los Alamos National Laboratory (LANL) Foundation, and will be updated at six-month intervals. Queries may be directed to belld@unm.edu.
COVID-19 Resource: Licensed Child Care Providers by School District
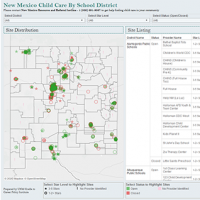
In partnership with the New Mexico Early Childhood Education and Care Department, CCPI has mapped licensed child care centers by school district, with features showing which centers are open and which ones have a FOCUS quality rating of 3-5. Child care closures are rapidly changing and the map will be updated periodically.
NM Early Childhood Care and Education Services, FY 20
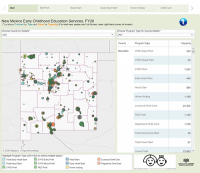
This comprehensive map of early childhood education services in New Mexico shows where early learning slots are funded across child care, New Mexico PreK, Early Head Start, Head Start, and home visiting. The dashboard allows users to select a county of interest, and to look at specific types of services within that county or statewide. These slots are shown against estimates of need, which vary by program and have been established to help stakeholders see where young children may remain underserved.
NM Early Childhood Care and Education Services, FY 19
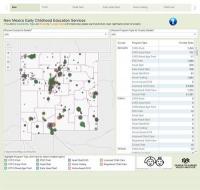
This comprehensive map of early childhood education services in New Mexico shows where early learning slots are funded across child care, New Mexico PreK, Early Head Start, Head Start, and home visiting. The dashboard allows users to select a county of interest, and to look at specific types of services within that county or statewide. These slots are shown against estimates of need, which vary by program and have been established to help stakeholders see where young children may remain underserved.
NM OAAA Data Hub
The New Mexico Office of African American Affairs data hub, maintained by CCPI, displays data related to the status of African Americans in New Mexico in domains including education, health care, economic empowerment, and community development. OAAA uses this information for advocacy, accountability, policy development and effective decision-making.
SUN PATH
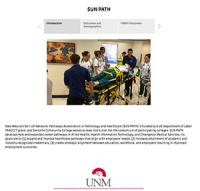
This tool shows key outcomes for the New Mexico’s Skill UP Network: Pathways Acceleration in Technology and Healthcare (SUN PATH) program. SUN PATH provides post-secondary workforce training in Allied Health, Health Information Technology, and Emergency Medical Services. The number of students taking part in SUN PATH, completing certificates and degrees, finding employment, and having increased wages are shown by SUN PATH campus.
New Mexico PreK

This tool makes available up-to-date information on all state-funded NM Pre-K and Early PreK programs operating in New Mexico, including those administered by the Children, Youth and Families Department, and the Public Education Department. The visualization shows service capacity by program and county, and estimates current need by county. Data is provided by NM CYFD and NMPED, for SY17 and prior years. Queries may be directed to belld@unm.edu (link sends e-mail).
Post-Secondary Degree Granters in New Mexico
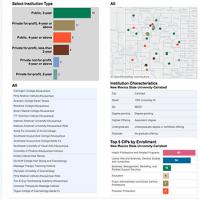
This tool provides an overview of post-secondary degree granting institutions in the state of New Mexico. Search for schools by geographic location, institution type, and enrollment characteristics.
APS Attendance Boundaries & SBA Performance
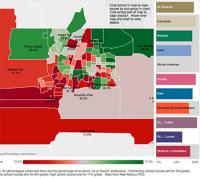
View some of the custom geography work we do at CEPR using Tableau. This Viz presents SBA proficiency scores for APS schools utilizing attendance boundaries for elementary, middle, and high schools.
Youth Risk & Resiliency Survey
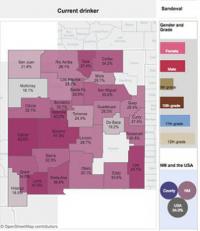
This tool makes available results from the most recent iteration of the YRRS. Survey results can be viewed for New Mexico and the United States, as well as by New Mexico Counties. Additionally included are example analyses that highlight some of the features and capabilities of Tableau Software.
AP Exam Pipeline

This Viz provides an example of student pipeline data using Tableau. View the Advanced Placement Pipeline (AP Enrollment > AP Exam Taking > AP Exam Passing) for school districts in New Mexico disaggregated by sub-group.
Mission: Graduate

View Mission: Graduate's Data Center. For additional details, http://missiongraduatenm.org/ (link is external)
Registered & Licensed Childcare Centers
View statewide locations of licensed and registered childcare centers. Search and aggregate by county and/or Census Designated Place. View census tract data and childcare center capacities/counts
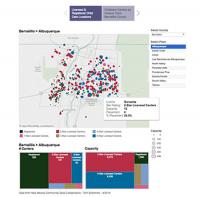
Mental & Behavioral Health Service Providers
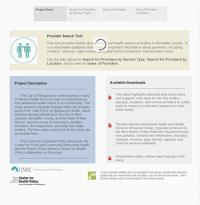
The City of ABQ commissioned a study of Mental Health Services to understand unmet behavioral health needs in our community. This tool provides details about behavioral health service providers in Bernalillo County.
RWJ's County Health Rankings 2014
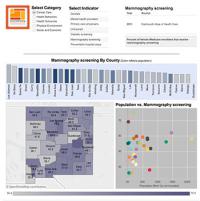
This tool un-packs the 2014 County Health Rankings for New Mexico Counties. View a variety of health-related indicators collated by Robert Wood Johnson.
Albuquerque Hiring & Skills Gap Survey

The ABQ Business Education Compact (ABEC) commissioned a study to see what challenges employers have in hiring workers with the skills needed to succeed. This Viz makes available aggregate findings of the survey and study.
